In data science, “Accuracy” is rarely enough. Depending on your problem—whether you are diagnosing a deadly disease, detecting spam, or predicting stock market trends—the way you define “success” changes completely.
This guide comments on every single metric derived from the Confusion Matrix, explaining what it is, when to use it, and the formula behind it.
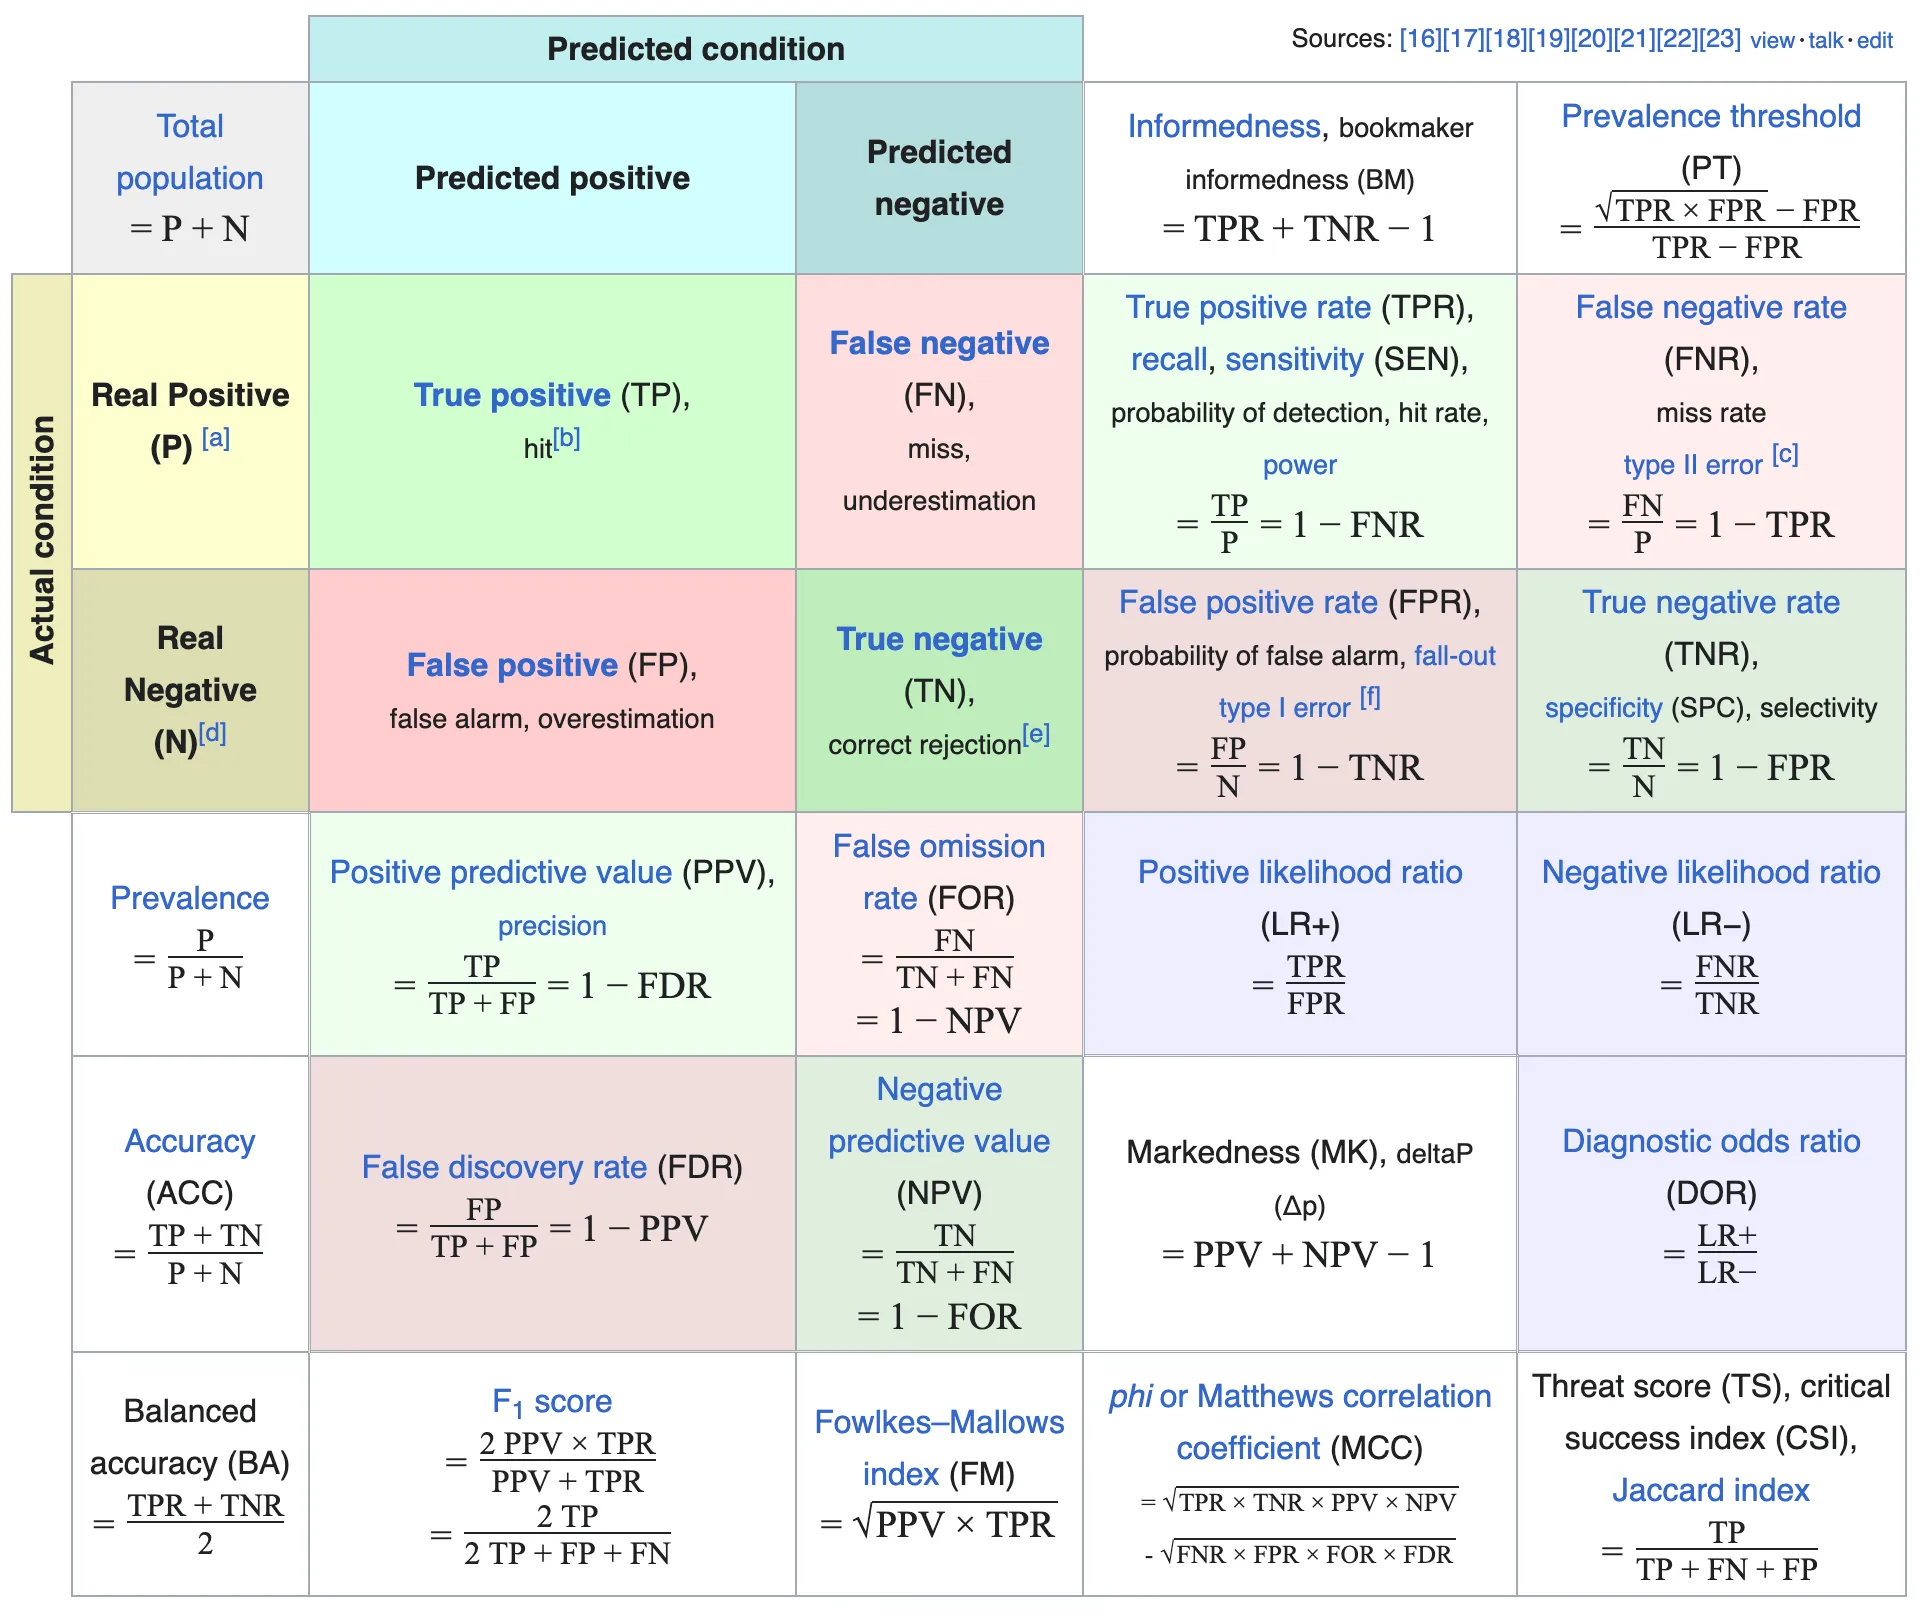
You are probably familiar with the following table from wiki on Sensitivity and specificity.

1. The Foundation: The Four Quadrants
Everything starts here. These are the raw counts from your model’s predictions.
- True Positive (TP): The Hit. The model predicted yes, and it was yes. (e.g., The fire alarm rang, and there was a fire.)
- True Negative (TN): The Correct Rejection. The model predicted no, and it was no. (e.g., The alarm stayed silent, and there was no fire.)
- False Positive (FP): The False Alarm (Type I Error). The model predicted yes, but it was actually no. (e.g., The alarm rang, but it was just burnt toast.)
- False Negative (FN): The Miss (Type II Error). The model predicted no, but it was actually yes. (e.g., The house burned down, and the alarm said nothing.)
2. The “Row” Metrics: How good are we at finding the truth?
These metrics look at the actual conditions (the rows of the matrix) and ask: “Did we capture them?”
True Positive Rate (TPR)
- Also known as: Recall, Sensitivity, Hit Rate, Power.
- Formula:
- The Gist: Of all the actual positive cases, what percentage did we catch?
- When to use: Crucial for medical screenings or safety systems where missing a case is dangerous.
False Negative Rate (FNR)
- Also known as: Miss Rate.
- Formula:
- The Gist: The opposite of Recall. What percentage of positive cases did we blindly ignore?
- When to use: When you need to report the “failure rate” of a safety system.
True Negative Rate (TNR)
- Also known as: Specificity, Selectivity.
- Formula:
- The Gist: Of all the actual negative cases, what percentage did we correctly identify as safe?
- When to use: Important in drug testing or criminal justice (you don’t want to convict an innocent person).
False Positive Rate (FPR)
- Also known as: Fall-out, Probability of False Alarm.
- Formula:
- The Gist: The rate of false alarms.
- When to use: In user experience contexts (e.g., users will turn off a security camera if it sends too many false alerts).
3. The “Column” Metrics: Can we trust the prediction?
These metrics look at the predicted values (the columns) and ask: “If the model says X, should I believe it?”
Positive Predictive Value (PPV)
- Also known as: Precision.
- Formula:
- The Gist: If the model screams “Positive!”, what is the probability it’s telling the truth?
- When to use: Spam filters, YouTube recommendations, or high-stakes stock picking.
False Discovery Rate (FDR)
- Formula:
- The Gist: If the model predicts positive, how often is it lying?
- When to use: Used heavily in multiple hypothesis testing and genetics to control the noise in large datasets.
Negative Predictive Value (NPV)
- Formula:
- The Gist: If the model says “Negative/Safe”, how sure can we be?
- When to use: Reassuring patients. If a cancer screening is negative, high NPV means the patient can truly relax.
False Omission Rate (FOR)
- Formula:
- The Gist: Of all the cases we labeled “Negative”, how many were actually dangerous misses?
4. The Context Metrics: The Environment
These metrics describe the dataset itself, not just the model.
Prevalence
- Formula:
- The Gist: How common is the positive case in the whole population?
- Why it matters: In very rare diseases (low prevalence), it is easy to get high Accuracy just by guessing “No” every time.
Prevalence Threshold (PT)
- Formula:
- The Gist: This is an advanced metric used in medical testing. It calculates the prevalence level at which the Positive Predictive Value (PPV) would drop to a specific threshold (often roughly 0.5). It helps determine if a screening test is even worth doing on a specific population.
5. The “Composite” Metrics: The Summary Scores
Single numbers that try to summarize the entire matrix.
Accuracy (ACC)
- Formula:
- The Gist: The ratio of correct predictions to total predictions.
- Warning: Misleading on imbalanced datasets.
Balanced Accuracy (BA)
- Formula:
- The Gist: The arithmetic mean of Sensitivity and Specificity.
- Why it’s better: It treats the Positive and Negative classes equally, even if the dataset doesn’t.
F1 Score
- Formula:
- The Gist: The go-to metric for imbalanced classification when you care about the Positive class. It penalizes you heavily if either Precision or Recall is low.
Matthews Correlation Coefficient (MCC)
- Also known as: Phi Coefficient.
- Formula:
- The Gist: A correlation coefficient between observed and predicted classifications. It ranges from -1 (total disagreement) to +1 (perfect prediction).
- Why it’s the Gold Standard: Unlike F1, MCC considers True Negatives. It is the most robust single metric for imbalanced data.
Fowlkes–Mallows Index (FM)
- Formula:
- The Gist: The geometric mean of Precision and Recall.
- Comment: Very similar to F1, but mathematically tends to be slightly higher. It checks the similarity between two clusterings.
Threat Score (TS)
- Also known as: Jaccard Index, Critical Success Index (CSI).
- Formula:
- The Gist: It measures the overlap between truth and prediction, ignoring the True Negatives entirely.
- When to use: Weather forecasting (predicting rain) and Computer Vision (Image Segmentation/IoU).
6. The “Information” Metrics: Medical & Probability
Advanced metrics for understanding the value a test adds.
Likelihood Ratios (LR+ and LR-)
- LR+: — How much more likely is a positive test found in a sick person vs. a healthy person? (You want this high, >10).
- LR-: — How much more likely is a negative test found in a sick person vs. a healthy person? (You want this low, <0.1).
Diagnostic Odds Ratio (DOR)
- Formula:
- The Gist: A single number indicating the effectiveness of a diagnostic test. A value of 1 means the test is useless; higher is better. It is widely used in meta-analyses of medical studies.
Informedness (Youden’s J)
- Formula:
- The Gist: The probability that an informed decision is made, rather than a random guess. It ranges from 0 (guessing) to 1 (perfect). It essentially rescales Balanced Accuracy to a 0-1 scale.
Markedness (MK)
- Formula:
- The Gist: The counterpart to Informedness. It measures how much confidence the prediction gives you about the real condition. If Markedness is 0, your predictors (Positive/Negative) tell you nothing about the actual reality.
Conclusion: Which one should you pick?
Don’t let the list overwhelm you. You usually only need to pick 2 or 3 based on your “Risk Profile”:
- Risk of Missing Out (FOMO)? Use Recall (Sensitivity).
- Risk of False Alarms? Use Precision.
- Imbalanced Data? Use MCC or F1 Score.
- Medical Diagnosis? Use Sensitivity, Specificity, and Likelihood Ratios.
The key is understanding what kind of mistake would be most costly in your specific context, and choosing metrics that directly measure that risk.